 |
Business, Transportation & Housing
The Business, Transportation and Housing Agency oversees and coordinates the activities of various departments, offices and economic development programs with responsibility for maintaining the strength and efficiency of California's infrastructure and financial markets. These programs provide financial and programmatic regulation important to an efficient marketplace and community development, assistance in ensuring patients' rights, and transportation infrastructure for the safe and efficient flow of people and commerce.
AGENCY'S PORTION OF THE BUDGET (State Funds)
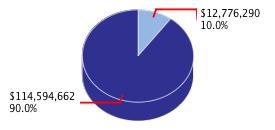
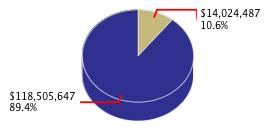
The following charts represent the Agency's portion of the 2011-12 Budget. These totals do not include federal funds, certain non-governmental cost funds, or reimbursements.
Proposed (January 2011) |
Revised (May 2011) |
 |
 |
STATE FUNDS BY DEPARTMENT Back to Top
The following table presents proposed and revised budget year expenditures for each department in this agency area. These totals do not include the expenditure of federal funds, certain non-governmental cost funds, or reimbursements.
| 0520 |
Business Transportation & Housing, Secy |
$5,893 |
$5,262 |
-$631 |
-10.71% |
| 2100 |
Department of Alcoholic Beverage Control |
54,762 |
54,762 |
- |
0.00% |
| 2120 |
Alcoholic Beverage Control Appeals Board |
1,029 |
1,029 |
- |
0.00% |
| 2150 |
Department of Financial Institutions |
33,832 |
33,882 |
50 |
0.15% |
| 2180 |
Department of Corporations |
47,247 |
47,247 |
- |
0.00% |
| 2240 |
Dept of Housing & Community Development |
40,096 |
130,096 |
90,000 |
224.46% |
| 2260 |
California Housing Finance Agency |
- |
- |
- |
- |
| 2310 |
Office of Real Estate Appraisers |
4,951 |
4,951 |
- |
0.00% |
| 2320 |
Department of Real Estate |
45,570 |
47,966 |
2,396 |
5.26% |
| 2400 |
Department of Managed Health Care |
51,202 |
51,202 |
- |
0.00% |
| 2600 |
California Transportation Commission |
28,407 |
28,407 |
- |
0.00% |
| 2640 |
State Transit Assistance |
829,587 |
829,587 |
- |
0.00% |
| 2660 |
Department of Transportation |
7,399,468 |
8,638,143 |
1,238,675 |
16.74% |
| 2665 |
High-Speed Rail Authority |
102,353 |
83,153 |
-19,200 |
-18.76% |
| 2670 |
Board of Pilot Commissioners |
2,190 |
2,190 |
- |
0.00% |
| 2700 |
Office of Traffic Safety |
428 |
428 |
- |
0.00% |
| 2720 |
Dept of the California Highway Patrol |
1,832,967 |
1,857,635 |
24,668 |
1.35% |
| 2740 |
Department of Motor Vehicles |
923,947 |
923,947 |
- |
0.00% |
| 2830 |
General Obligation Bonds-BT&H |
1,372,361 |
1,284,600 |
-87,761 |
-6.39% |
| Totals, Expenditures |
$12,776,290 |
$14,024,487 |
$1,248,197 |
9.77% |
ALL FUNDS BY DEPARTMENT Back to Top
The following table presents proposed and revised budget year expenditures for each department in this agency area. Total All Funds include state funds, federal funds, other non-governmental costs funds, and reimbursements necessary to support the operations of department programs.
| 0520 |
Business Transportation & Housing, Secy |
$100,912 |
$16,893 |
-$84,019 |
-83.26% |
| 2100 |
Department of Alcoholic Beverage Control |
57,171 |
57,171 |
- |
0.00% |
| 2120 |
Alcoholic Beverage Control Appeals Board |
1,029 |
1,029 |
- |
0.00% |
| 2150 |
Department of Financial Institutions |
35,054 |
35,104 |
50 |
0.14% |
| 2180 |
Department of Corporations |
47,397 |
47,397 |
- |
0.00% |
| 2240 |
Dept of Housing & Community Development |
255,970 |
392,298 |
136,328 |
53.26% |
| 2260 |
California Housing Finance Agency |
50,604 |
50,604 |
- |
0.00% |
| 2310 |
Office of Real Estate Appraisers |
5,031 |
5,031 |
- |
0.00% |
| 2320 |
Department of Real Estate |
46,005 |
48,401 |
2,396 |
5.21% |
| 2400 |
Department of Managed Health Care |
52,381 |
56,286 |
3,905 |
7.45% |
| 2600 |
California Transportation Commission |
28,914 |
28,914 |
- |
0.00% |
| 2640 |
State Transit Assistance |
829,587 |
829,587 |
- |
0.00% |
| 2660 |
Department of Transportation |
12,808,155 |
14,054,912 |
1,246,757 |
9.73% |
| 2665 |
High-Speed Rail Authority |
192,025 |
149,718 |
-42,307 |
-22.03% |
| 2670 |
Board of Pilot Commissioners |
2,190 |
2,190 |
- |
0.00% |
| 2700 |
Office of Traffic Safety |
96,945 |
96,945 |
- |
0.00% |
| 2720 |
Dept of the California Highway Patrol |
1,968,681 |
1,993,349 |
24,668 |
1.25% |
| 2740 |
Department of Motor Vehicles |
945,918 |
945,918 |
- |
0.00% |
| 2830 |
General Obligation Bonds-BT&H |
1,372,361 |
1,284,600 |
-87,761 |
-6.39% |
| Totals, Expenditures |
$18,896,330 |
$20,096,347 |
$1,200,017 |
6.35% |
PERSONNEL YEARS BY DEPARTMENT Back to Top
The following table presents proposed and revised budget year personnel years for each department within this agency area.
| 0520 |
Business Transportation & Housing, Secy |
60.7 |
60.7 |
- |
0.00% |
| 2100 |
Department of Alcoholic Beverage Control |
428.2 |
428.2 |
- |
0.00% |
| 2120 |
Alcoholic Beverage Control Appeals Board |
8.3 |
8.3 |
- |
0.00% |
| 2150 |
Department of Financial Institutions |
250.2 |
250.2 |
- |
0.00% |
| 2180 |
Department of Corporations |
313.8 |
313.8 |
- |
0.00% |
| 2240 |
Dept of Housing & Community Development |
568.7 |
568.7 |
- |
0.00% |
| 2260 |
California Housing Finance Agency |
336.2 |
336.2 |
- |
0.00% |
| 2310 |
Office of Real Estate Appraisers |
32.1 |
32.1 |
- |
0.00% |
| 2320 |
Department of Real Estate |
342.8 |
340.9 |
-1.9 |
-0.55% |
| 2400 |
Department of Managed Health Care |
334.5 |
334.5 |
- |
0.00% |
| 2600 |
California Transportation Commission |
18.1 |
18.1 |
- |
0.00% |
| 2640 |
State Transit Assistance |
- |
- |
- |
- |
| 2660 |
Department of Transportation |
20,376.9 |
20,375.1 |
-1.8 |
-0.01% |
| 2665 |
High-Speed Rail Authority |
37.1 |
51.4 |
14.3 |
38.54% |
| 2670 |
Board of Pilot Commissioners |
4.0 |
4.0 |
- |
0.00% |
| 2700 |
Office of Traffic Safety |
33.0 |
33.0 |
- |
0.00% |
| 2720 |
Dept of the California Highway Patrol |
11,380.7 |
11,380.7 |
- |
0.00% |
| 2740 |
Department of Motor Vehicles |
8,250.9 |
8,250.9 |
- |
0.00% |
| 2830 |
General Obligation Bonds-BT&H |
- |
- |
- |
- |
| Totals, Personnel Years |
42,776.2 |
42,786.8 |
10.6 |
0.02% |
ADDITIONAL INFORMATION Back to Top
Business, Transportation & Housing Web Site
Transfers user to this Agency's web site.
Proposed Budget Detail - Business, Transportation & Housing (January 2011)
Displays Proposed Budget Detail Information for Business, Transportation & Housing.
|

