 |
Health and Human Services
Health and human services programs provide essential medical, dental, mental health, and social services to many of California's most vulnerable and at-risk residents. These programs touch the lives of millions of Californians and provide access to critical services that promote their health, well-being, and ability to function in society. The mission of the Health and Human Services Agency also includes recognizing children as a priority investment, promoting personal responsibility for services, and enhancing program effectiveness and accountability.
AGENCY'S PORTION OF THE BUDGET (State Funds)
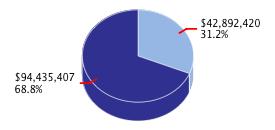
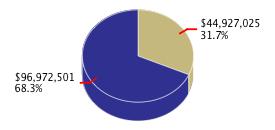
The following charts represent the Agency's portion of the 2012-13 Budget. These totals do not include federal funds, certain non-governmental cost funds, or reimbursements.
Proposed (January 2012) |
Revised (May 2012) |
 |
 |
STATE FUNDS BY DEPARTMENT Back to Top
The following table presents proposed and revised budget year expenditures for each department in this agency area. These totals do not include the expenditure of federal funds, certain non-governmental cost funds, or reimbursements.
| 0530 |
Health & Human Services Agency, Secy |
$14,023 |
$16,068 |
$2,045 |
14.58% |
| 4100 |
State Council-Developmental Disabilities |
- |
- |
- |
- |
| 4120 |
Emergency Medical Services Authority |
10,248 |
10,248 |
- |
0.00% |
| 4140 |
Statewide Health Planning & Development |
105,928 |
126,050 |
20,122 |
19.00% |
| 4150 |
Department of Managed Health Care |
- |
50,042 |
50,042 |
- |
| 4170 |
Department of Aging |
36,966 |
36,493 |
-473 |
-1.28% |
| 4180 |
Commission on Aging |
- |
- |
- |
- |
| 4185 |
California Senior Legislature |
- |
- |
- |
- |
| 4200 |
Department of Alcohol & Drug Programs |
- |
- |
- |
- |
| 4250 |
Children & Families Commission |
442,886 |
442,886 |
- |
0.00% |
| 4260 |
Department of Health Care Services |
22,105,841 |
21,954,821 |
-151,020 |
-0.68% |
| 4265 |
Department of Public Health |
940,720 |
1,000,162 |
59,442 |
6.32% |
| 4270 |
California Medical Assistance Commission |
- |
- |
- |
- |
| 4280 |
Managed Risk Medical Insurance Board |
249,666 |
270,713 |
21,047 |
8.43% |
| 4300 |
Department of Developmental Services |
2,684,768 |
2,657,768 |
-27,000 |
-1.01% |
| 4440 |
Department of State Hospitals |
1,367,611 |
1,368,381 |
770 |
0.06% |
| 4560 |
Mental Hlth Svcs Ovrst and Acntblty Comm |
6,671 |
6,671 |
- |
0.00% |
| 4700 |
Dept of Community Services & Development |
- |
- |
- |
- |
| 4800 |
California Health Benefit Exchange |
- |
- |
- |
- |
| 5160 |
Department of Rehabilitation |
56,997 |
56,997 |
- |
0.00% |
| 5170 |
State Independent Living Council |
- |
- |
- |
- |
| 5175 |
Department of Child Support Services |
313,226 |
307,589 |
-5,637 |
-1.80% |
| 5180 |
Department of Social Services |
6,269,611 |
6,358,389 |
88,778 |
1.42% |
| 5195 |
State-Local Realignment |
4,347,047 |
4,307,421 |
-39,626 |
-0.91% |
| 5196 |
State-Local Realignment, 2011 |
3,873,680 |
5,889,795 |
2,016,115 |
52.05% |
| 5206 |
General Obligation Bonds-H&HS |
66,531 |
66,531 |
- |
0.00% |
| Totals, Expenditures |
$42,892,420 |
$44,927,025 |
$2,034,605 |
4.74% |
ALL FUNDS BY DEPARTMENT Back to Top
The following table presents proposed and revised budget year expenditures for each department in this agency area. Total All Funds include state funds, federal funds, other non-governmental costs funds, and reimbursements necessary to support the operations of department programs.
| 0530 |
Health & Human Services Agency, Secy |
$200,996 |
$211,274 |
$10,278 |
5.11% |
| 4100 |
State Council-Developmental Disabilities |
11,558 |
11,558 |
- |
0.00% |
| 4120 |
Emergency Medical Services Authority |
27,573 |
27,573 |
- |
0.00% |
| 4140 |
Statewide Health Planning & Development |
116,502 |
136,786 |
20,284 |
17.41% |
| 4150 |
Department of Managed Health Care |
- |
51,983 |
51,983 |
- |
| 4170 |
Department of Aging |
195,290 |
194,503 |
-787 |
-0.40% |
| 4180 |
Commission on Aging |
440 |
440 |
- |
0.00% |
| 4185 |
California Senior Legislature |
480 |
480 |
- |
0.00% |
| 4200 |
Department of Alcohol & Drug Programs |
- |
- |
- |
- |
| 4250 |
Children & Families Commission |
442,886 |
442,886 |
- |
0.00% |
| 4260 |
Department of Health Care Services |
60,953,112 |
62,375,889 |
1,422,777 |
2.33% |
| 4265 |
Department of Public Health |
3,427,669 |
3,465,419 |
37,750 |
1.10% |
| 4270 |
California Medical Assistance Commission |
- |
- |
- |
- |
| 4280 |
Managed Risk Medical Insurance Board |
965,569 |
1,021,936 |
56,367 |
5.84% |
| 4300 |
Department of Developmental Services |
4,682,613 |
4,755,853 |
73,240 |
1.56% |
| 4440 |
Department of State Hospitals |
1,530,363 |
1,533,139 |
2,776 |
0.18% |
| 4560 |
Mental Hlth Svcs Ovrst and Acntblty Comm |
6,671 |
6,671 |
- |
0.00% |
| 4700 |
Dept of Community Services & Development |
260,183 |
262,130 |
1,947 |
0.75% |
| 4800 |
California Health Benefit Exchange |
39,421 |
39,421 |
- |
0.00% |
| 5160 |
Department of Rehabilitation |
421,287 |
421,287 |
- |
0.00% |
| 5170 |
State Independent Living Council |
717 |
717 |
- |
0.00% |
| 5175 |
Department of Child Support Services |
998,798 |
981,151 |
-17,647 |
-1.77% |
| 5180 |
Department of Social Services |
17,501,678 |
17,741,926 |
240,248 |
1.37% |
| 5195 |
State-Local Realignment |
4,347,047 |
4,307,421 |
-39,626 |
-0.91% |
| 5196 |
State-Local Realignment, 2011 |
3,873,680 |
5,889,795 |
2,016,115 |
52.05% |
| 5206 |
General Obligation Bonds-H&HS |
66,531 |
66,531 |
- |
0.00% |
| Totals, Expenditures |
$100,071,064 |
$103,946,769 |
$3,875,705 |
3.87% |
PERSONNEL YEARS BY DEPARTMENT Back to Top
The following table presents proposed and revised budget year personnel years for each department within this agency area.
| 0530 |
Health & Human Services Agency, Secy |
216.2 |
242.3 |
26.1 |
12.07% |
| 4100 |
State Council-Developmental Disabilities |
87.4 |
92.0 |
4.6 |
5.26% |
| 4120 |
Emergency Medical Services Authority |
64.3 |
64.2 |
-0.1 |
-0.16% |
| 4140 |
Statewide Health Planning & Development |
473.6 |
475.6 |
2.0 |
0.42% |
| 4150 |
Department of Managed Health Care |
- |
347.8 |
347.8 |
100.00% |
| 4170 |
Department of Aging |
124.2 |
114.7 |
-9.5 |
-7.65% |
| 4180 |
Commission on Aging |
3.5 |
3.5 |
- |
0.00% |
| 4185 |
California Senior Legislature |
1.0 |
1.0 |
- |
0.00% |
| 4200 |
Department of Alcohol & Drug Programs |
- |
- |
- |
- |
| 4250 |
Children & Families Commission |
- |
- |
- |
- |
| 4260 |
Department of Health Care Services |
3,380.8 |
3,409.2 |
28.4 |
0.84% |
| 4265 |
Department of Public Health |
3,807.4 |
3,767.2 |
-40.2 |
-1.06% |
| 4270 |
California Medical Assistance Commission |
- |
- |
- |
- |
| 4280 |
Managed Risk Medical Insurance Board |
99.7 |
104.9 |
5.2 |
5.22% |
| 4300 |
Department of Developmental Services |
5,614.5 |
5,531.0 |
-83.5 |
-1.49% |
| 4440 |
Department of State Hospitals |
9,861.3 |
9,953.3 |
92.0 |
0.93% |
| 4560 |
Mental Hlth Svcs Ovrst and Acntblty Comm |
19.9 |
21.0 |
1.1 |
5.53% |
| 4700 |
Dept of Community Services & Development |
128.5 |
132.5 |
4.0 |
3.11% |
| 4800 |
California Health Benefit Exchange |
90.3 |
95.0 |
4.7 |
5.20% |
| 5160 |
Department of Rehabilitation |
1,777.0 |
1,823.0 |
46.0 |
2.59% |
| 5170 |
State Independent Living Council |
3.0 |
3.0 |
- |
0.00% |
| 5175 |
Department of Child Support Services |
573.5 |
593.5 |
20.0 |
3.49% |
| 5180 |
Department of Social Services |
4,288.2 |
4,220.5 |
-67.7 |
-1.58% |
| 5195 |
State-Local Realignment |
- |
- |
- |
- |
| 5196 |
State-Local Realignment, 2011 |
- |
- |
- |
- |
| 5206 |
General Obligation Bonds-H&HS |
- |
- |
- |
- |
| Totals, Personnel Years |
30,614.3 |
30,995.2 |
380.9 |
1.24% |
ADDITIONAL INFORMATION Back to Top
Health and Human Services Web Site
Transfers user to this Agency's web site.
Proposed Budget Detail - Health and Human Services (January 2012)
Displays Proposed Budget Detail Information for Health and Human Services.
|

